Skip to content

Likert Scale Assessment Report

The report for the likert scale assessments provides insights into students’ attitudes, perceptions, beliefs, and experiences related to learning. By comparing pre- and post-instruction responses across multiple constructs, the report helps instructors better understand changes in student perspectives over time.

Overview

This report allows you to explore how student responses to Likert-scale assessments change across administrations. It combines participation data, descriptive statistics, and construct-level visualizations to support the interpretation of student attitudes and perceptions.

The report includes:

  • Participation and completion rates
  • Mean scores by construct
  • Standard deviation and variability measures
  • Construct-level comparisons between pre- and posttests
  • Visualizations with confidence indicators

Key Features

Course-Level Insights

The report summarizes participation rates and completion data for each administration. Descriptive statistics provide mean scores and variability measures for all assessed constructs, helping instructors understand overall trends in student responses.

Construct-Level Analysis

The report compares pre- and posttest mean scores across constructs. These comparisons help identify areas where student attitudes and perceptions remained stable or changed over time.

Visualization of Student Responses

A plot display mean percentage scores for each construct along with error bars representing standard error. These visualizations make it easier to compare constructs and interpret variation in student responses across administrations.

How It Works?

By default, the report generates results using all available administrations for the selected assessment.

After the report loads, you can:

  • Explore construct-level results across administrations
  • Review descriptive statistics and visualizations
  • Download a PDF version of the report at any time

Instruments:

This report works with Likert-scale assessments available in LASSO.

FAQ

A construct is a category or dimension measured by the assessment. Examples may include confidence, personal interest, conceptual understanding, or real-world connections.

Each construct score summarizes student responses to a group of related questions.

The percentages represent average student responses converted to a percentage scale for easier interpretation and comparison across constructs and administrations.

Higher percentages generally indicate stronger agreement or more positive responses, depending on the assessment design.

The error bars represent the standard error (SE) around the mean score for each construct. They provide an indication of variability and uncertainty in the estimated mean.

Smaller error bars suggest more consistent responses among students.

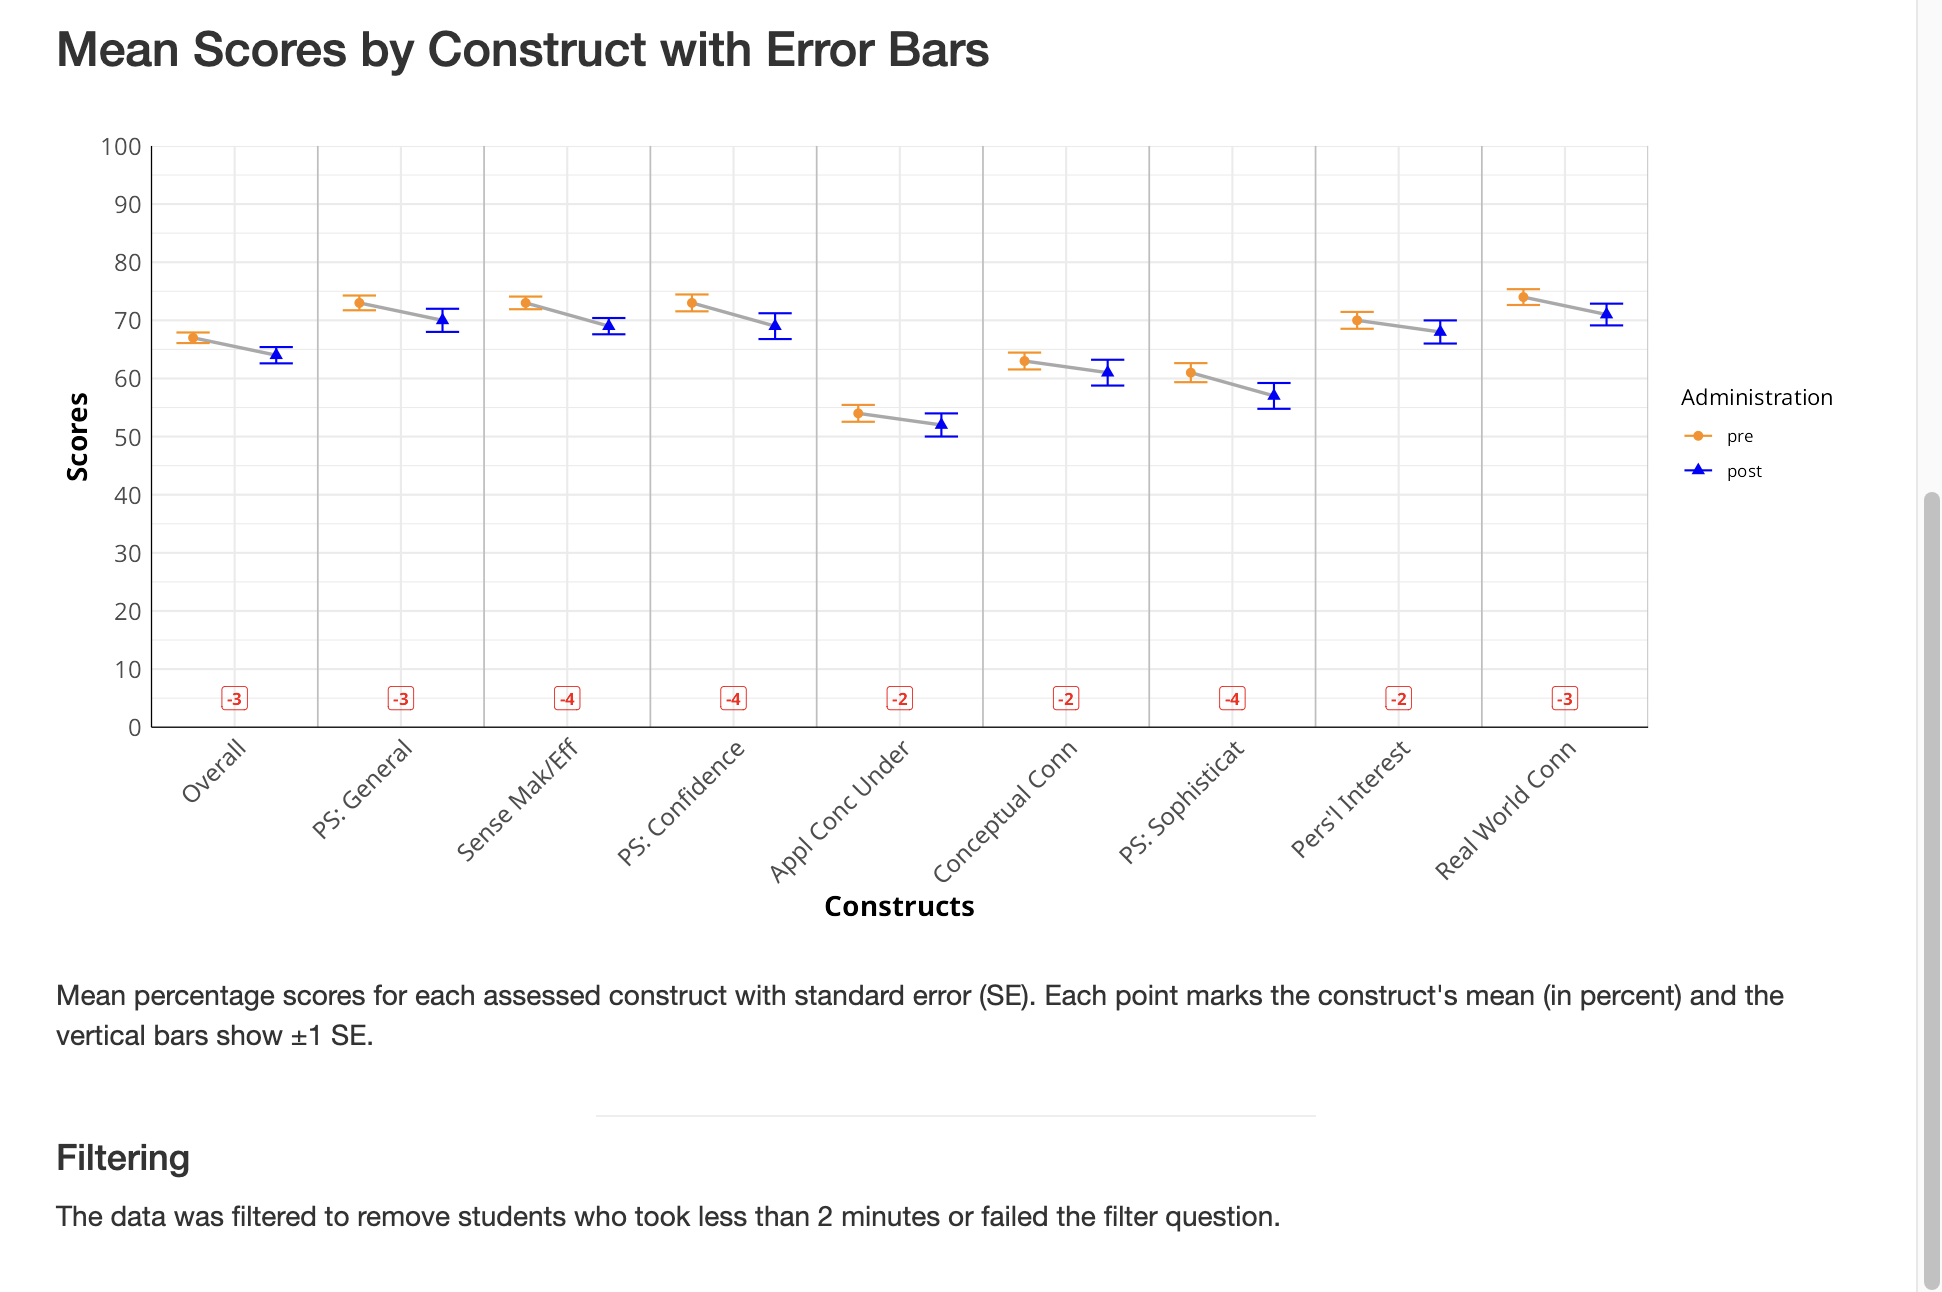
Yes. The report is designed to support comparisons across administrations, allowing instructors to examine changes in student attitudes and perceptions over time.

Small differences, however, should be interpreted cautiously and within the broader instructional context.

The report filters out responses from students who spent less than 3 minutes on the assessment or failed the filter question. This helps improve the reliability of the results.

Yes. You can download a PDF version of the report at any time. 

Changes in construct scores may reflect shifts in student attitudes, confidence, interest, or perceptions throughout the course. These results should be interpreted as indicators of broader trends rather than precise measurements of individual change.