Cognitive Diagnostic Report - Course Level
The report for cognitive diagnostic assessments provides detailed insights into student learning by measuring proficiency and skill mastery. It helps instructors understand what students know, what they are still developing, and how their skills evolve across assessments.
Overview
This report allows you to analyze student performance at both the course and individual levels. It combines proficiency scores, skill mastery results, and comparisons across administrations to provide a comprehensive view of learning.
The report includes:
- Proficiency scores and equivalent scores
- Distribution of students across proficiency levels
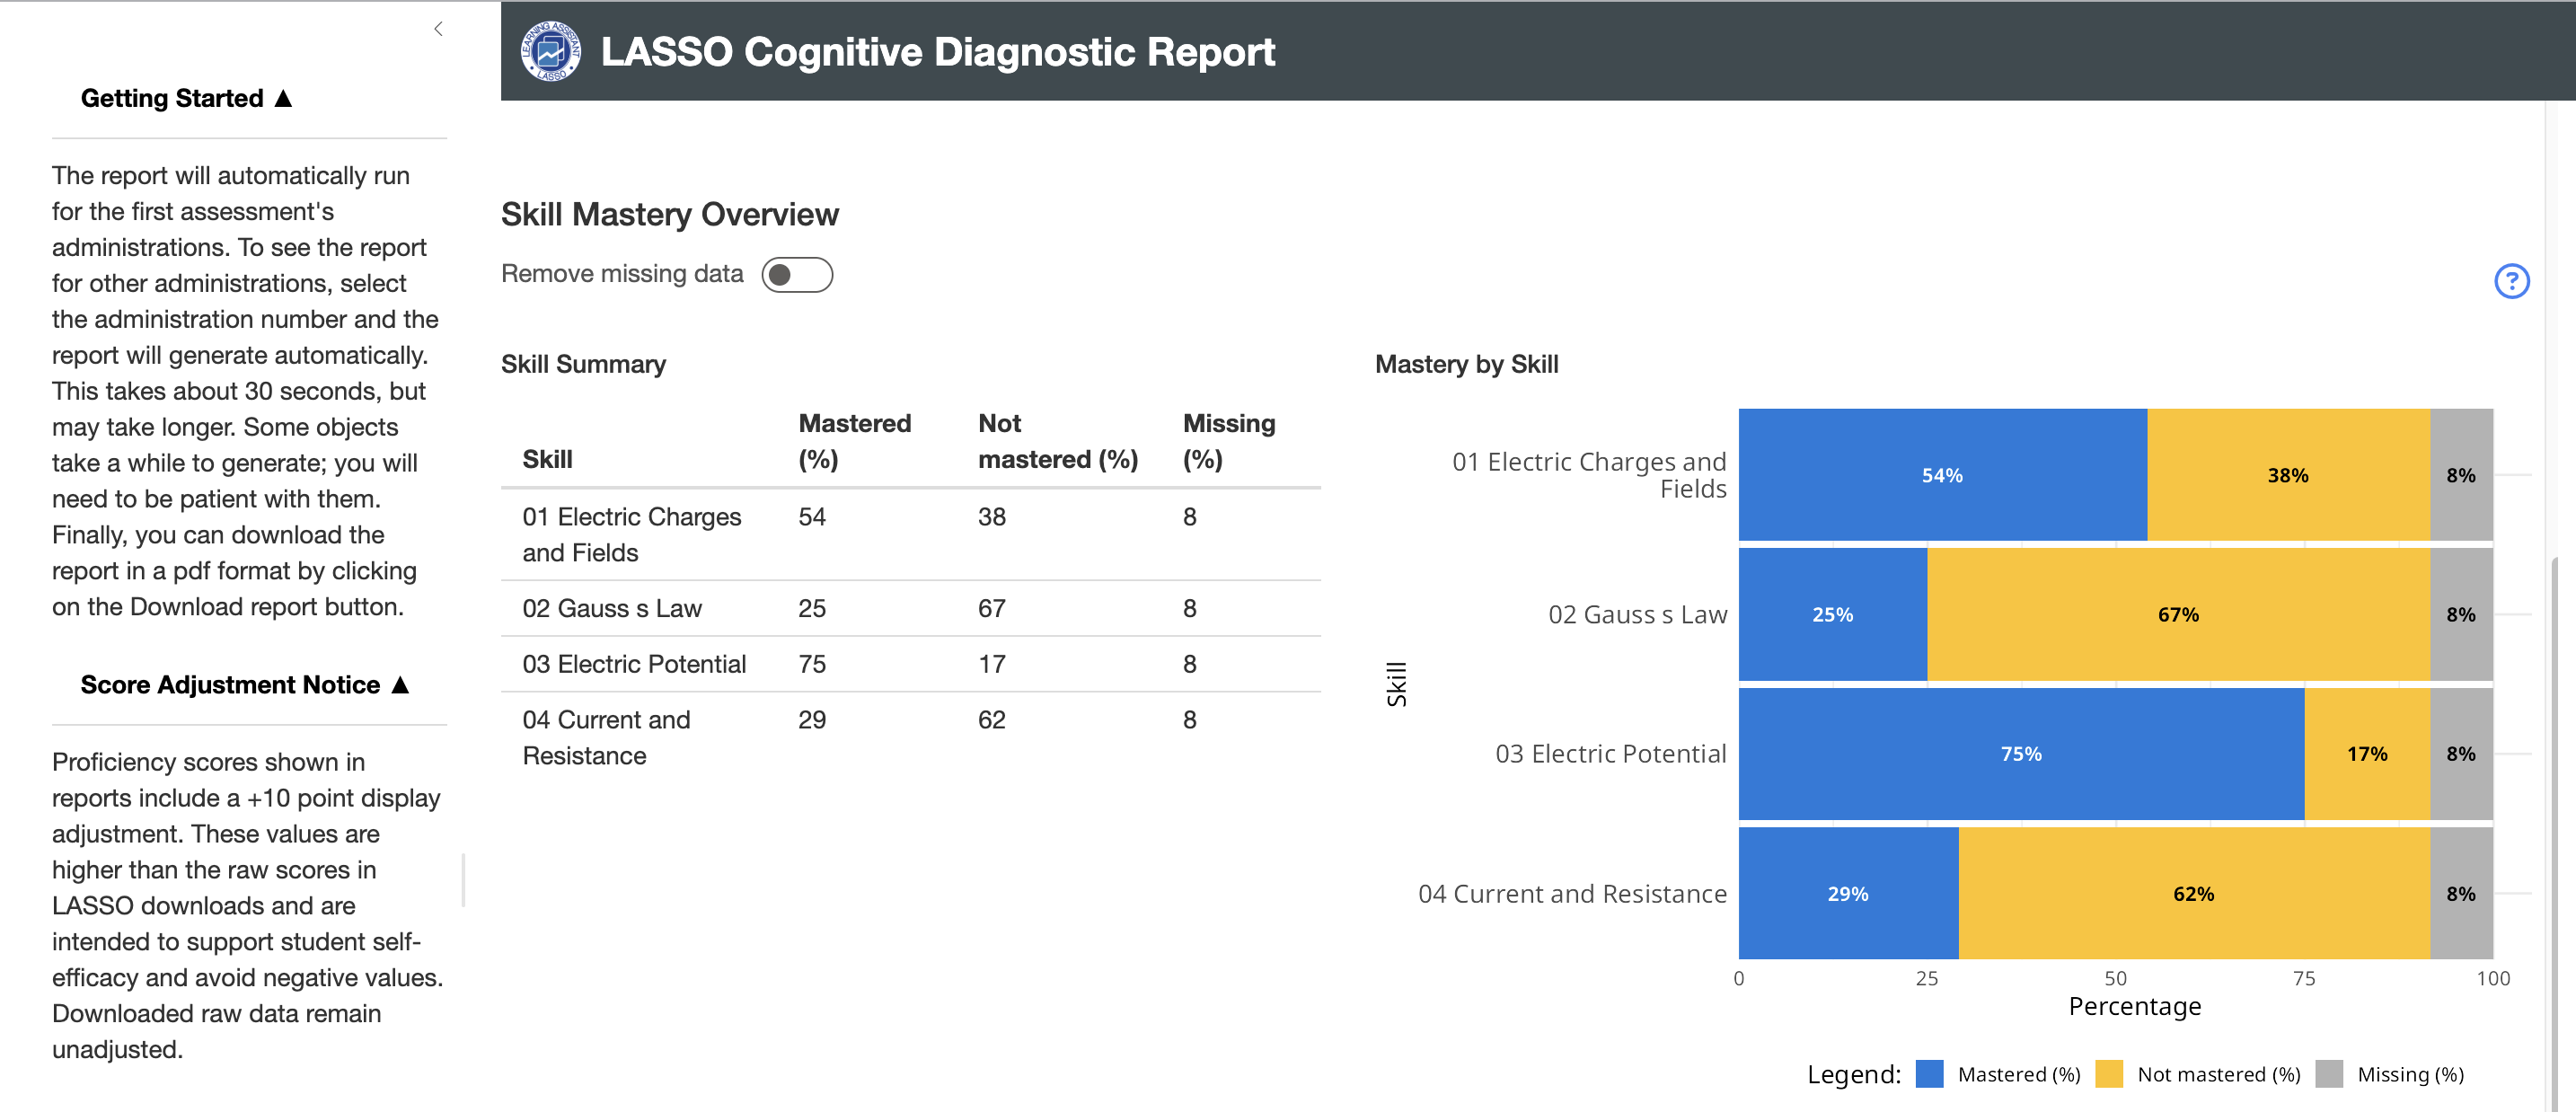
- Skill mastery by learning objectives
- Student-level performance data
- Comparisons across multiple administrations
- Comparisons with other similar assessments
Key Features
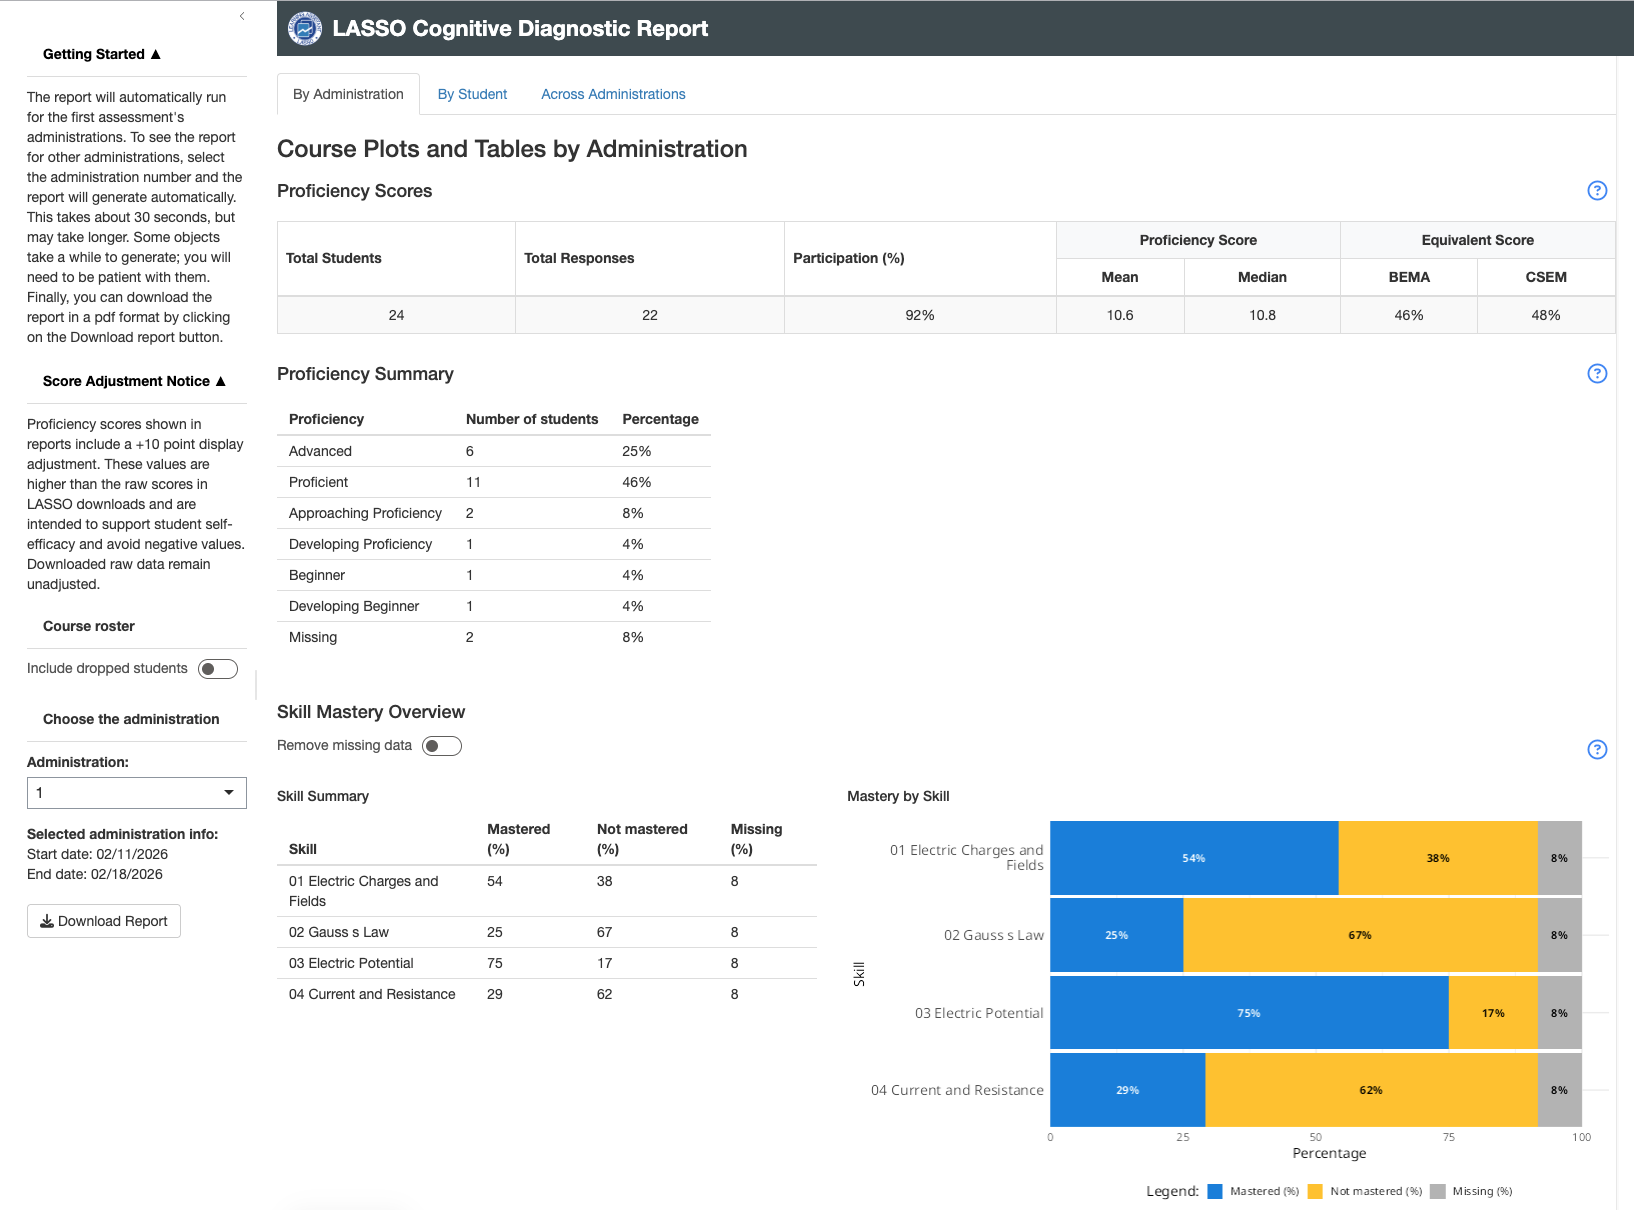
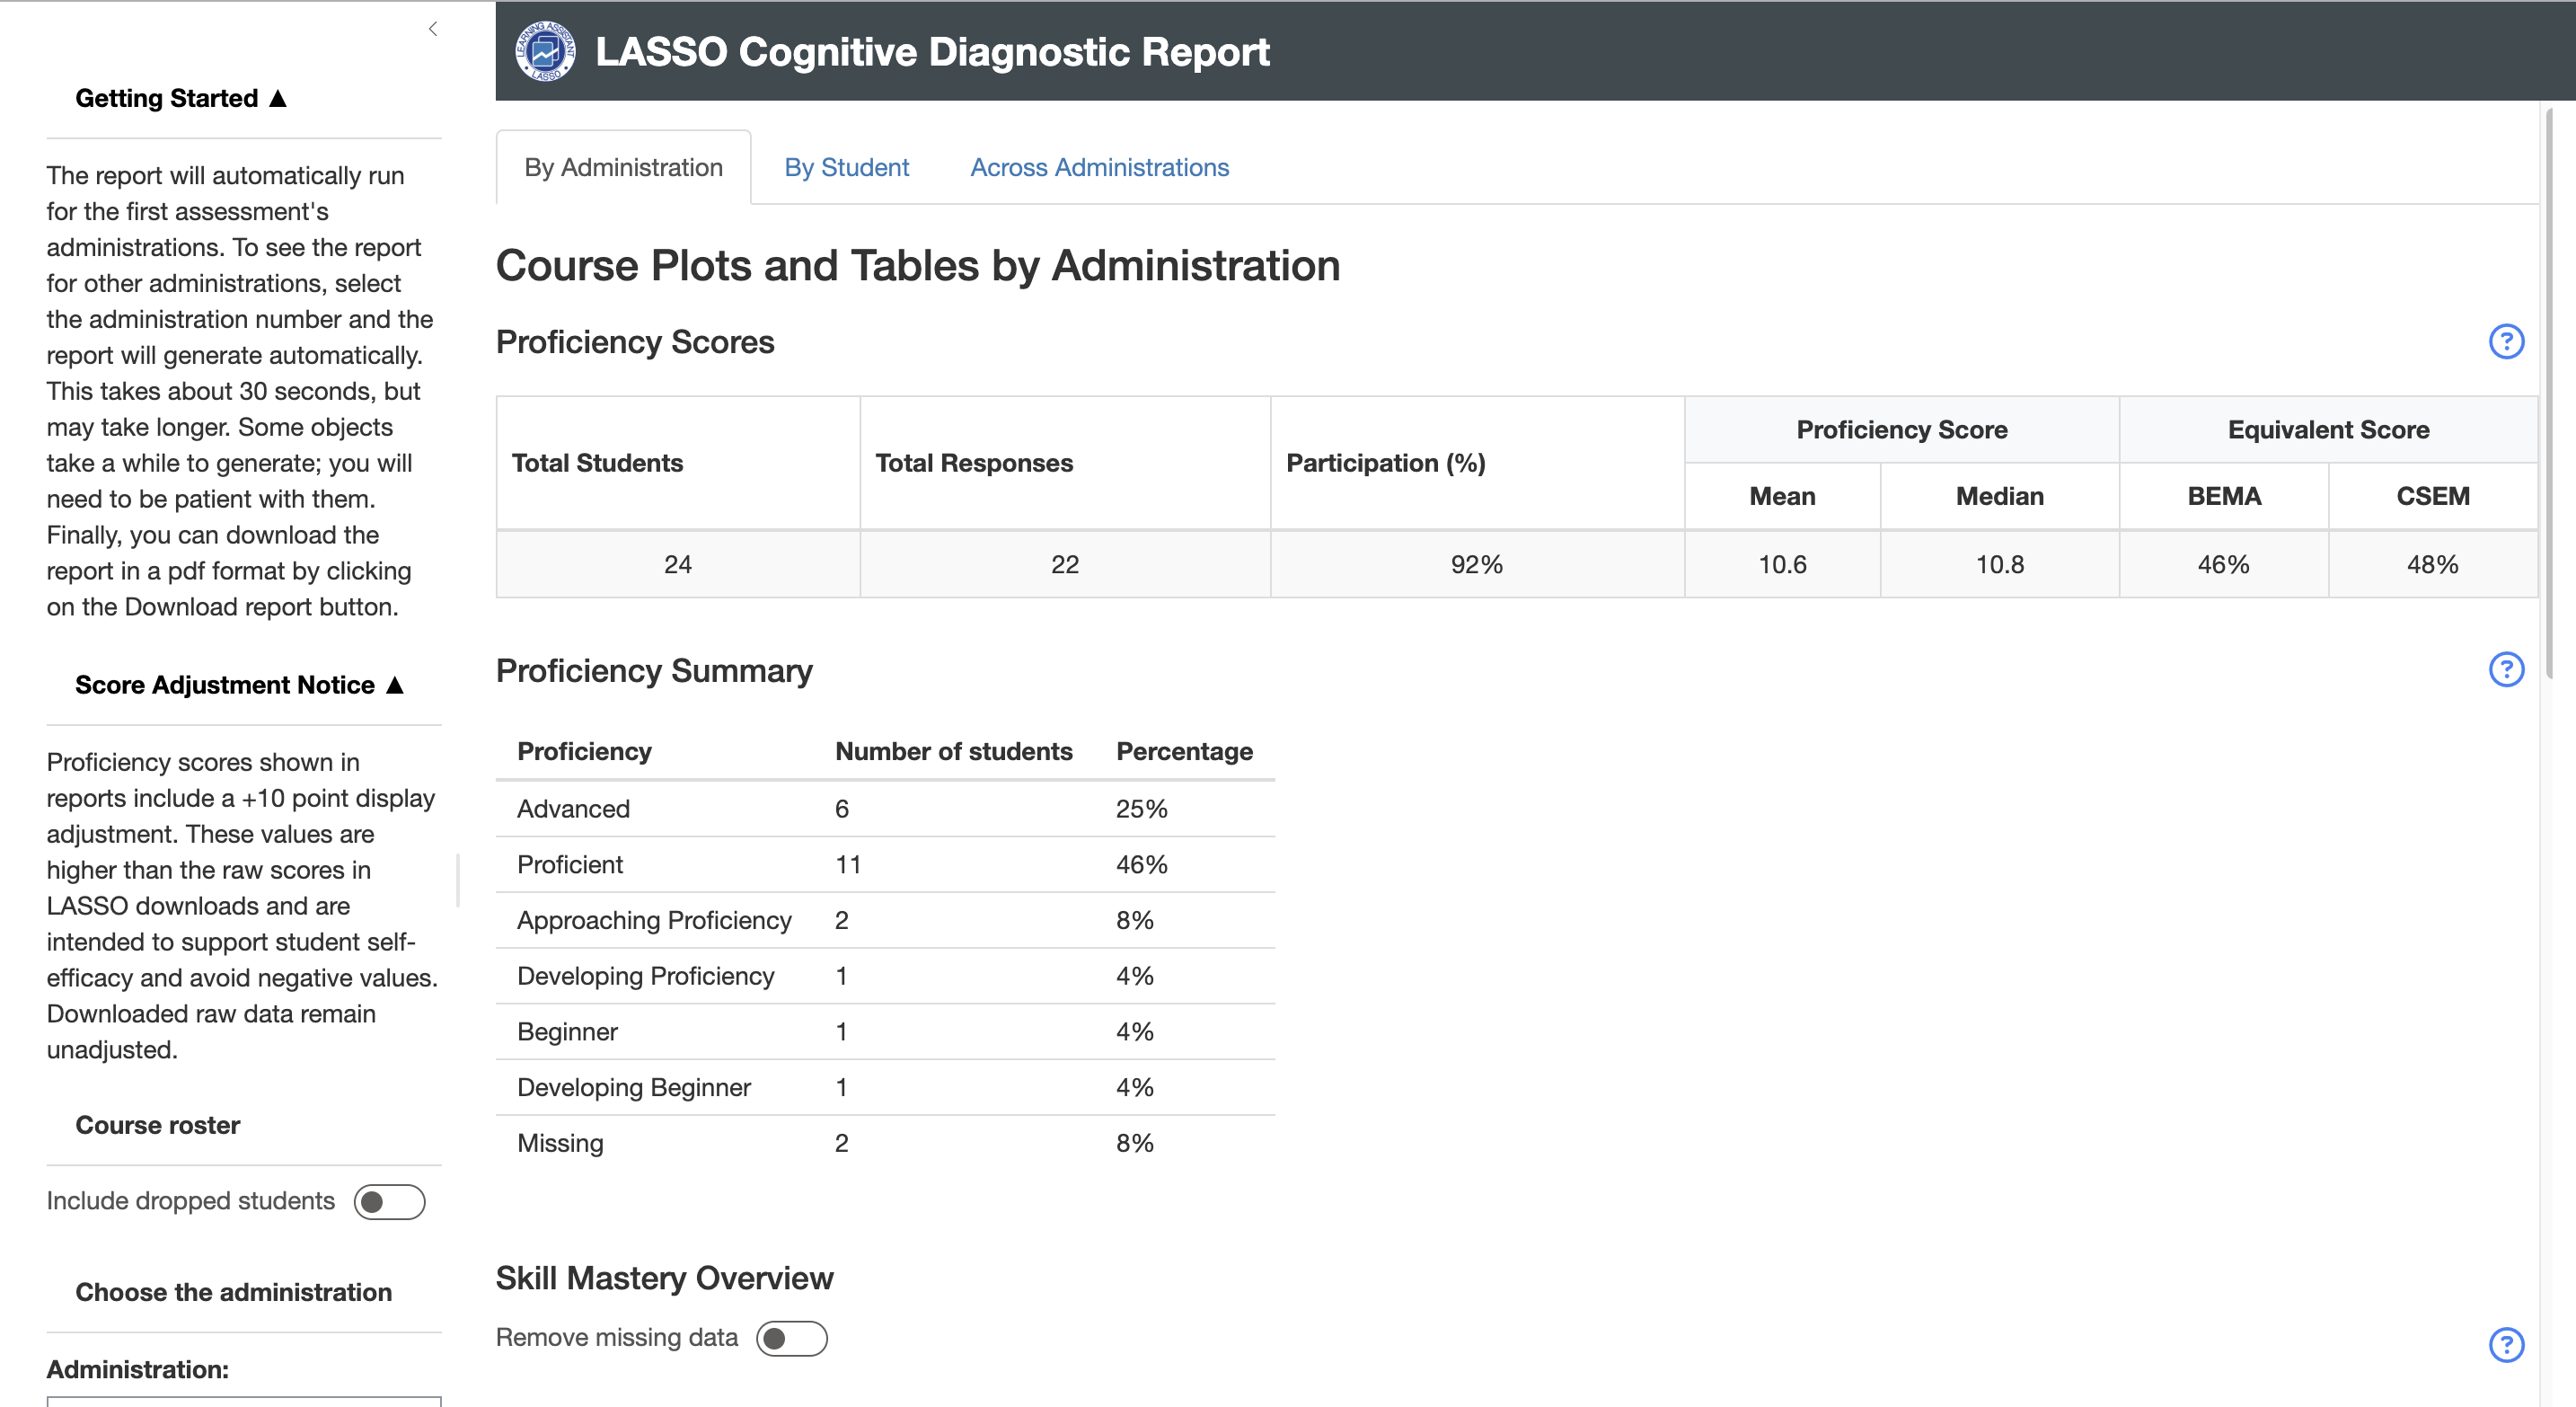
By Administration
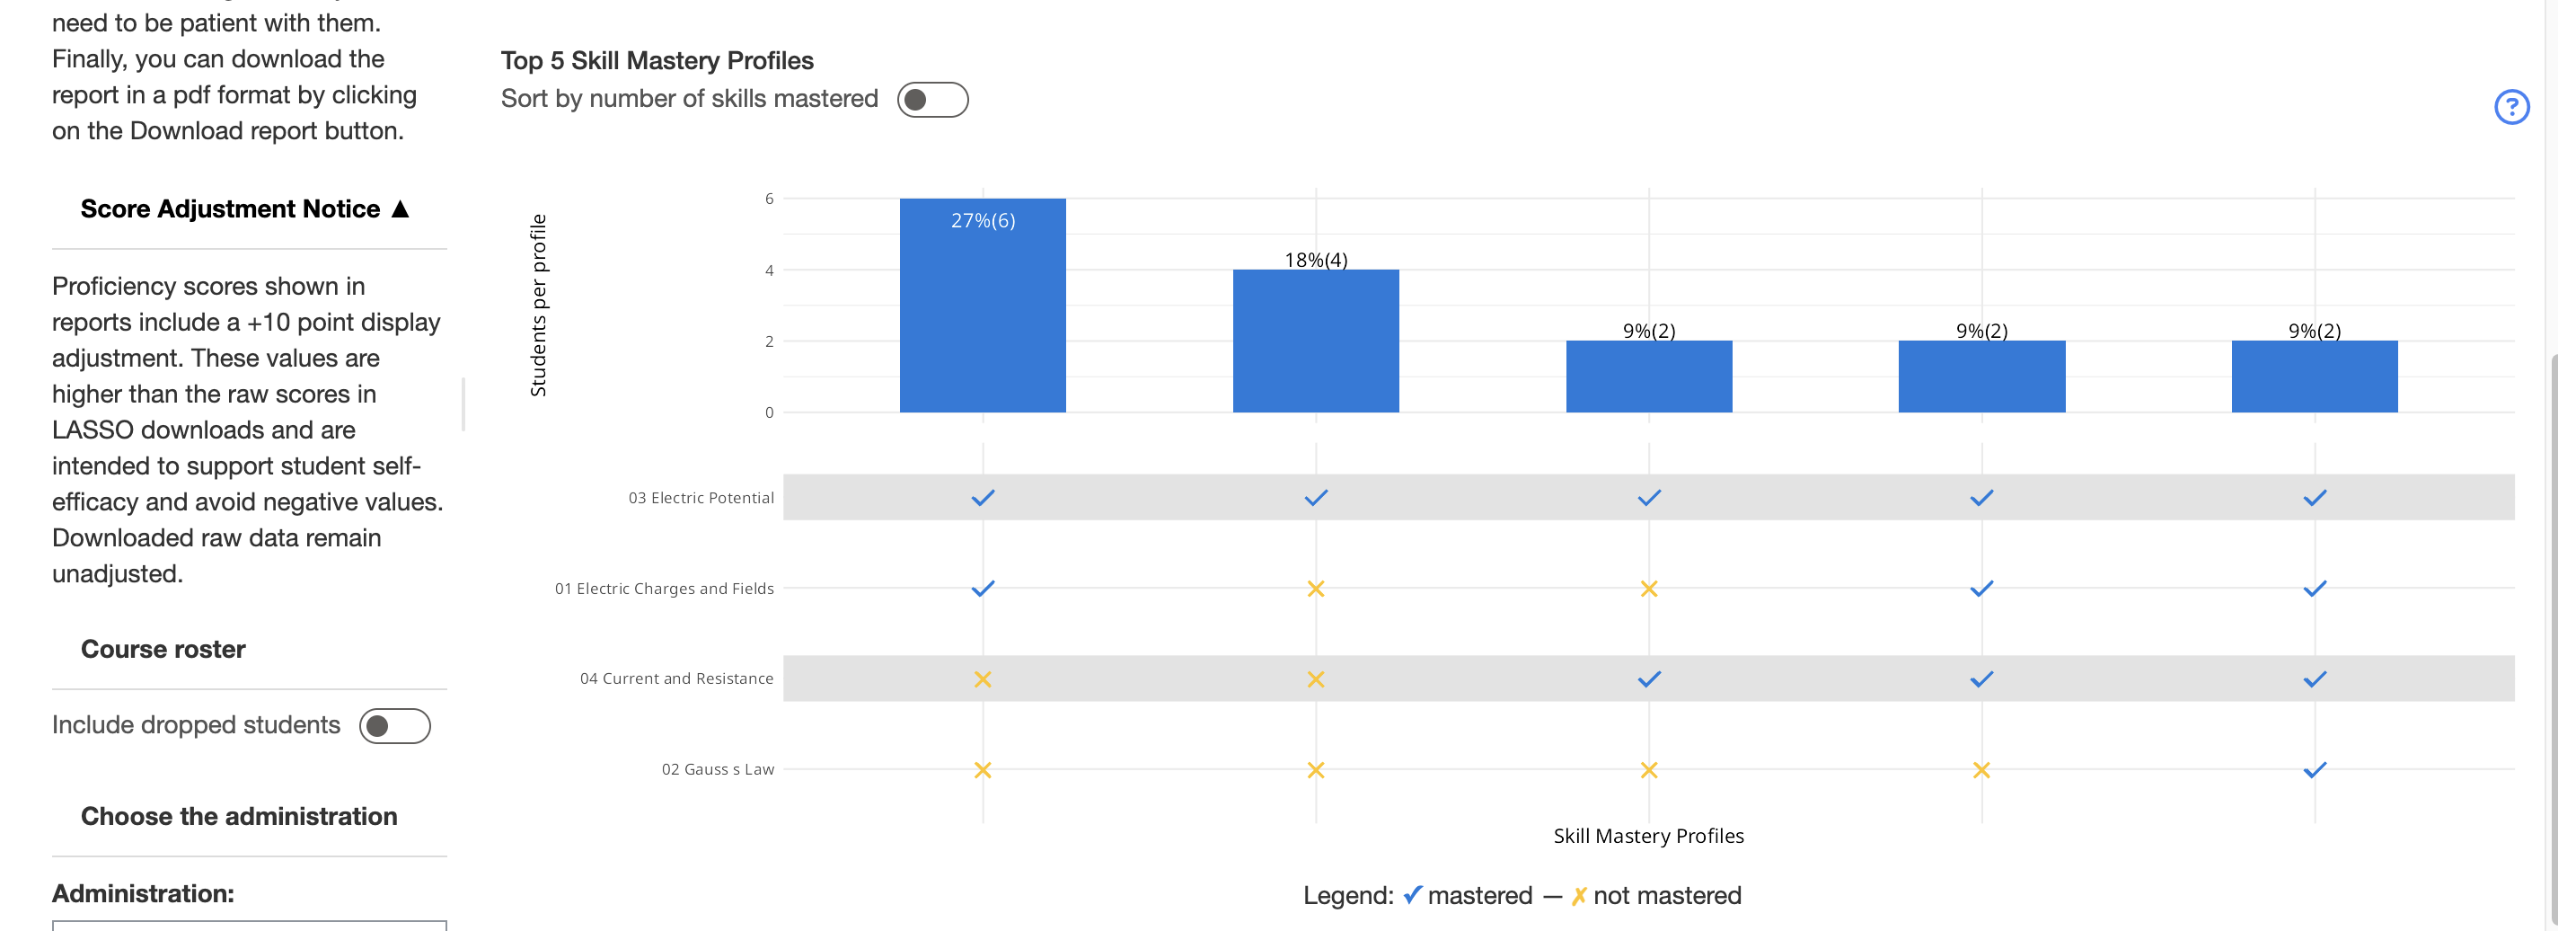
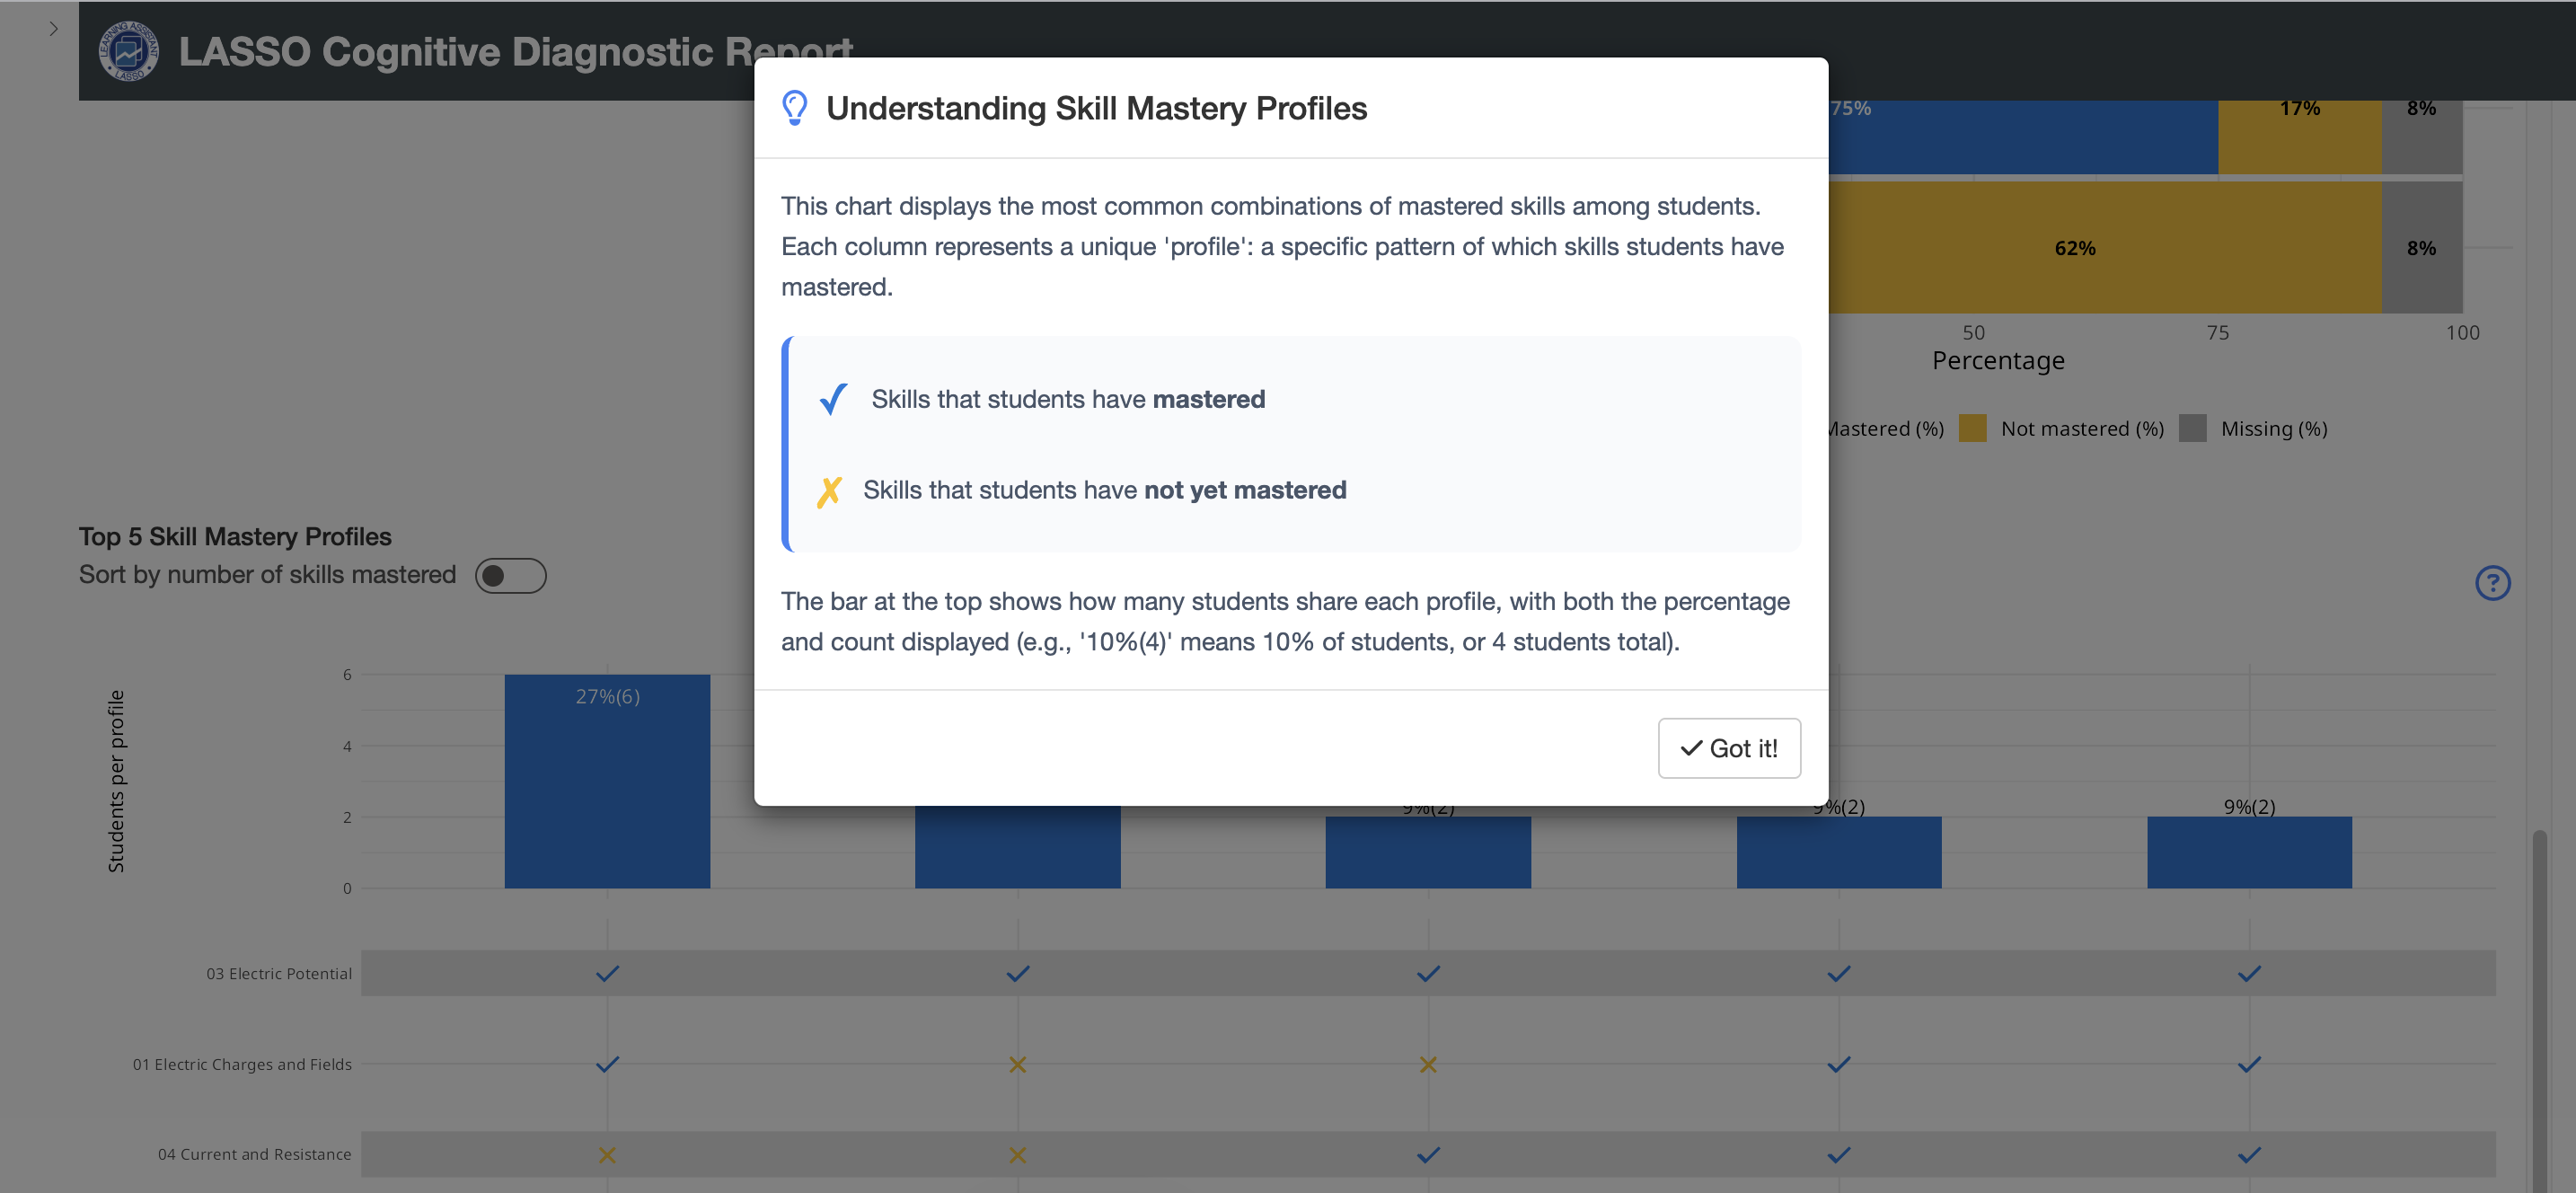
This view provides a snapshot of student performance for a single assessment administration. It includes proficiency scores, participation rates, and equivalent scores, along with a summary of how students are distributed across proficiency levels. Skill-level results show the percentage of students who have mastered each learning objective, supported by visualizations and tables. Skill mastery profiles highlight common patterns in how students combine mastered and unmastered skills, helping identify areas where additional support may be needed.
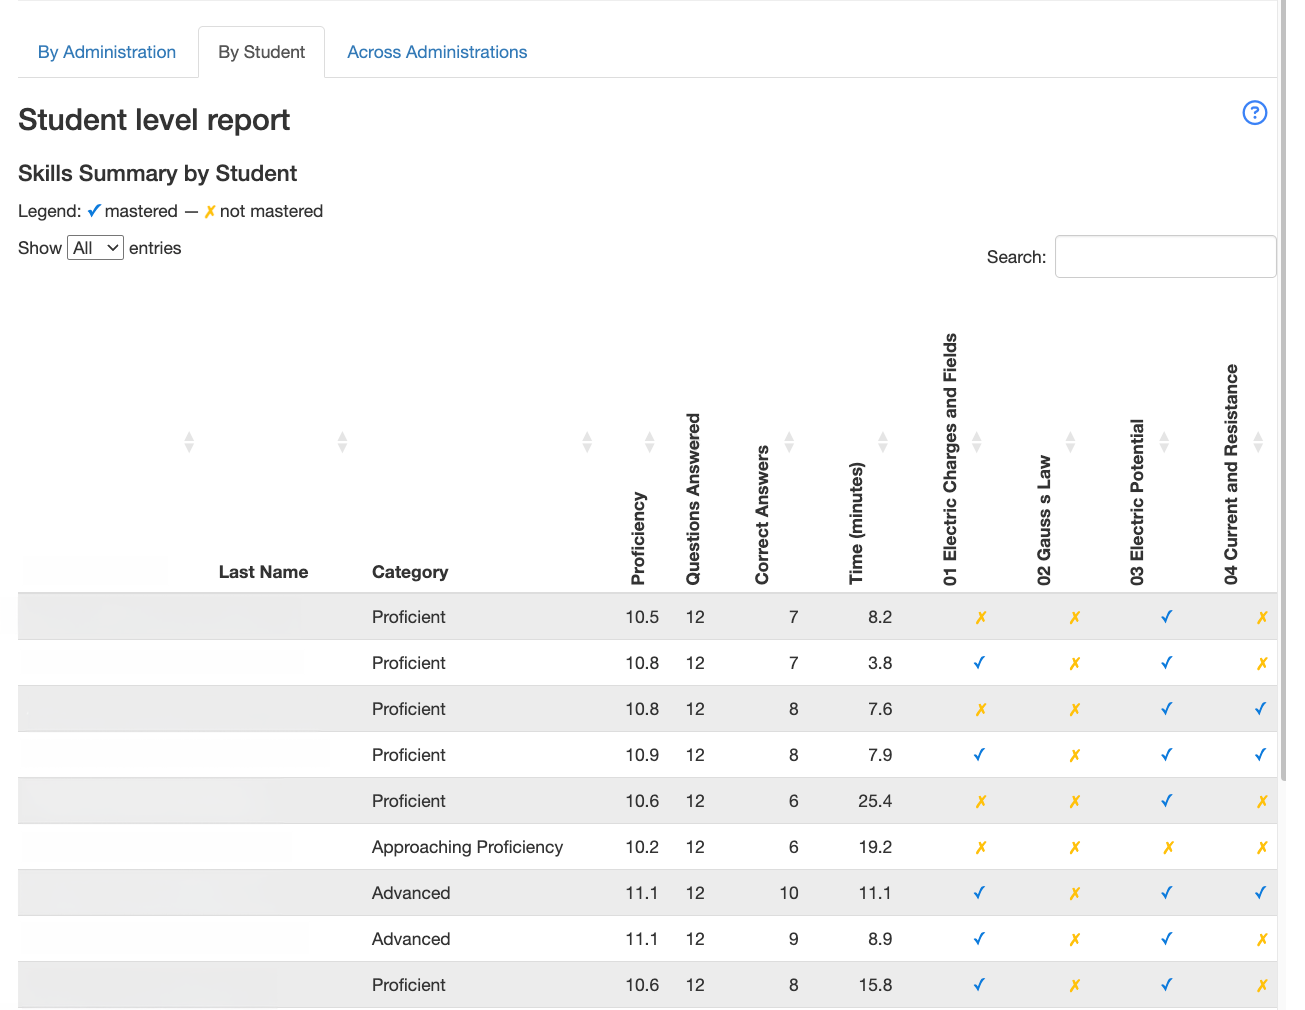
By Student
This view provides detailed, student-level results. It includes proficiency categories, performance metrics, and skill mastery for each student. Instructors can use this table to examine individual progress, identify learning gaps, and better understand how students are performing across different skills.
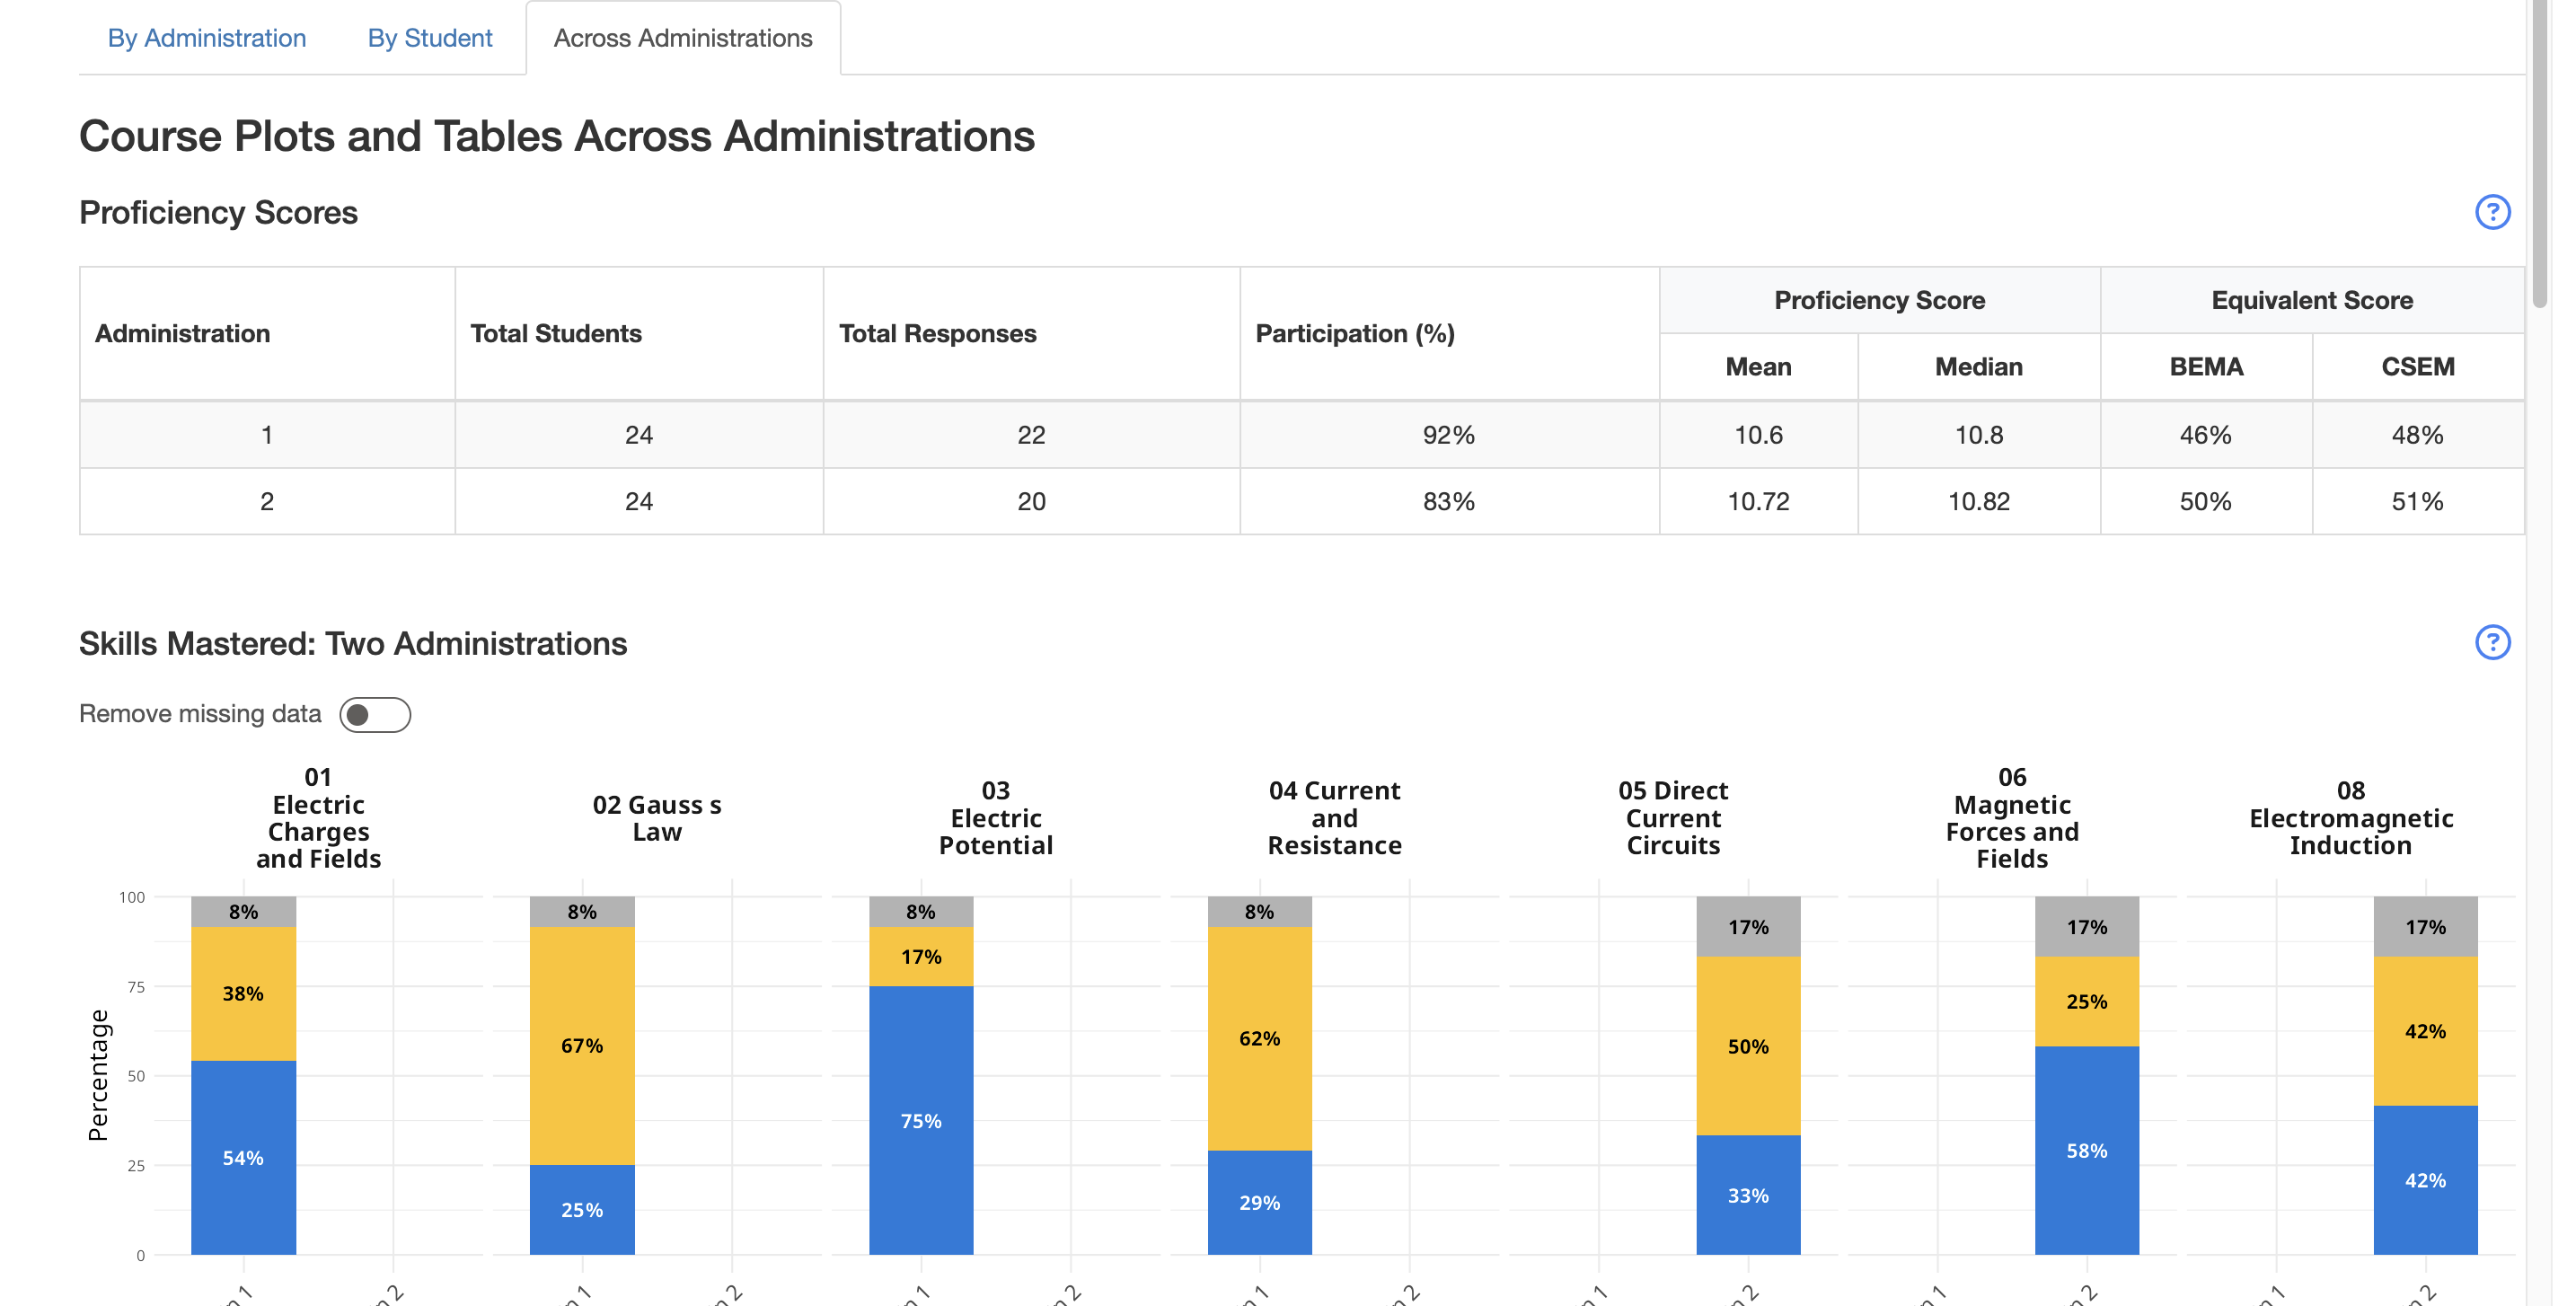
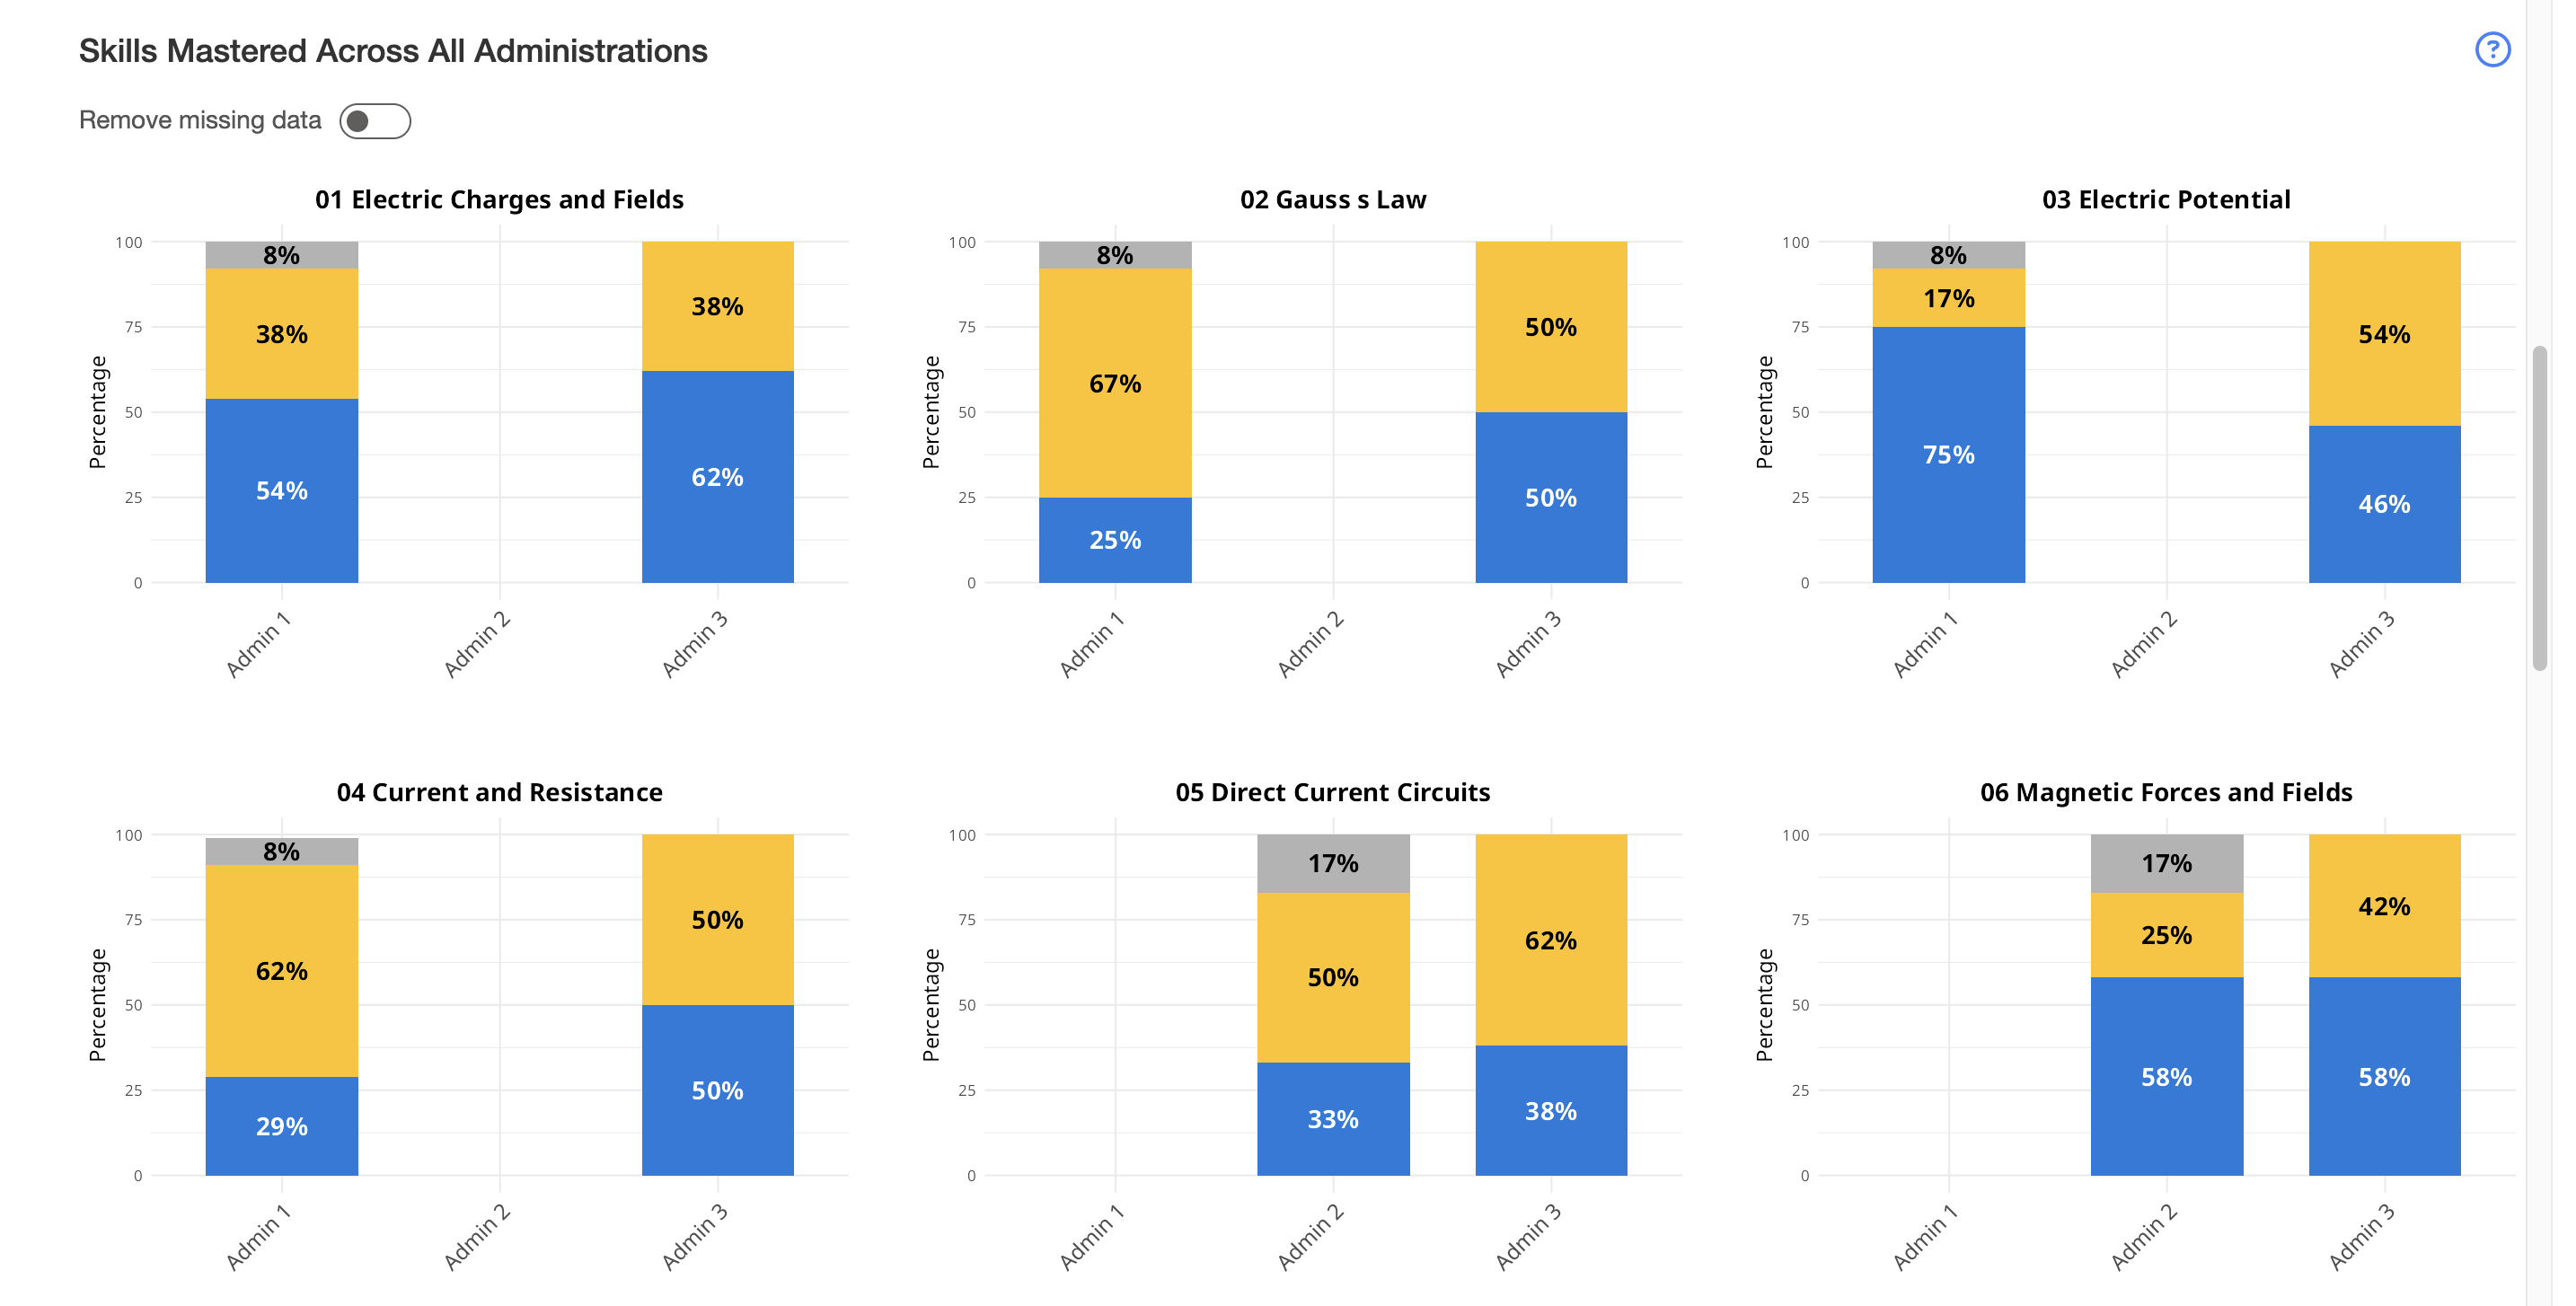
Across Administrations
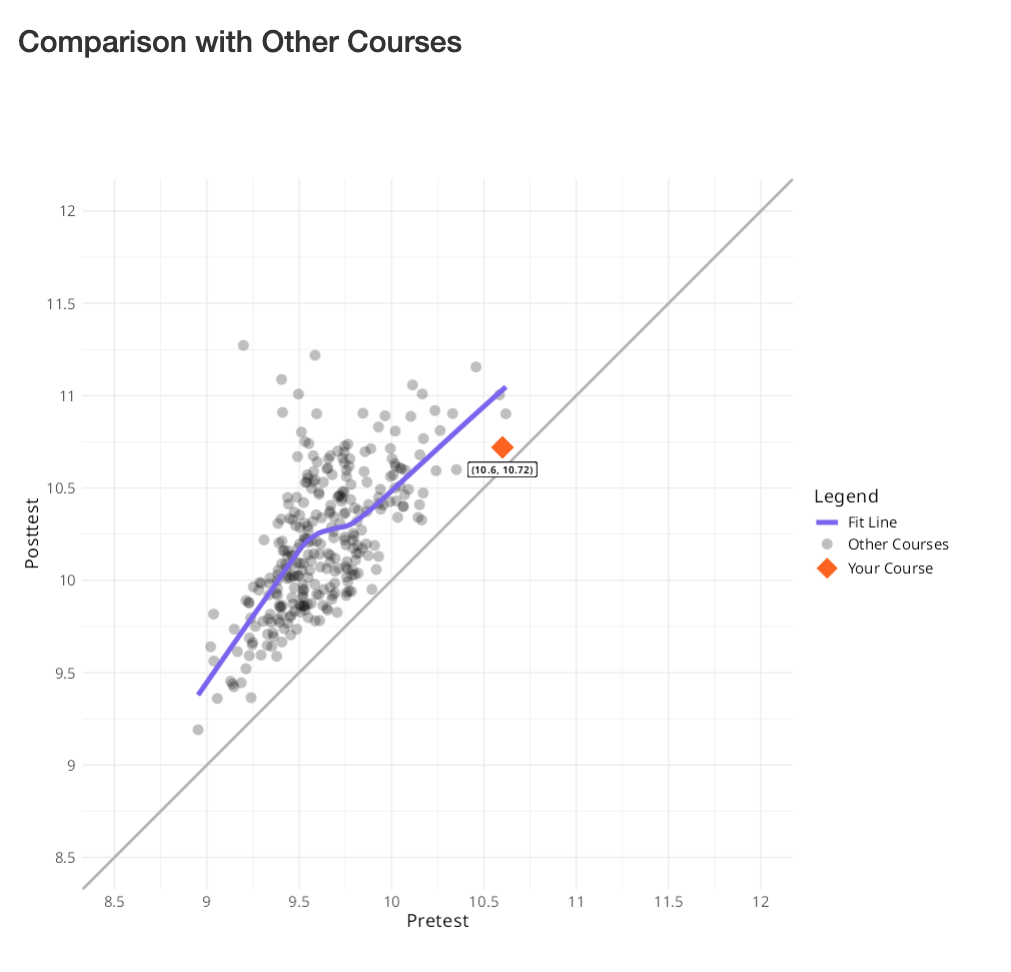
This view compares results across multiple assessment administrations. It shows changes in proficiency scores and skill mastery over time, helping instructors evaluate the impact of instruction. Visualizations highlight trends in skill development across administrations and allow you to explore how mastery evolves. When available, comparisons with other courses provide additional context by situating your results within the broader LASSO dataset.
How It Works?
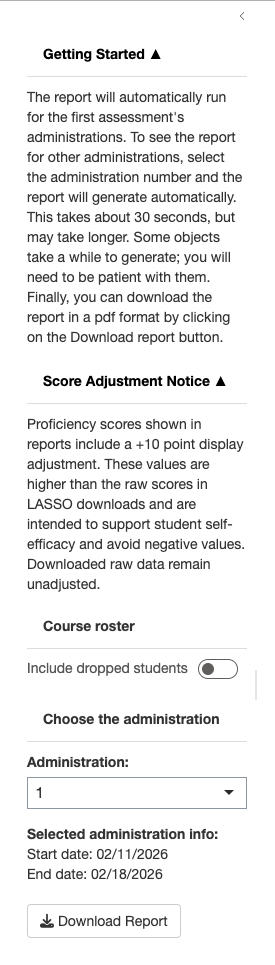
By default, the report generates results for the first available administration. You can:
- Select different administrations to update the report
- Explore results by administration, by student, or across administrations
- View skill mastery with or without missing data
- Add students who dropped the course to the reports
You can download a PDF version of the report at any time. The downloaded report will reflect your selected options and settings.
Instruments:
This report works with cognitive diagnostic assessments available in LASSO.
Comparisons with other similar assessments are available for instruments with sufficient data in the LASSO database.
FAQ
Mastery indicates whether a student demonstrated sufficient understanding of a specific skill or learning objective based on their assessment responses. Students are classified as either “mastered” or “not mastered” for each skill included in the assessment.
The proficiency score is a standardized score that estimates a student’s overall performance relative to a national reference population. The score is scaled with a mean of 10 and a standard deviation of 1 using an Item Response Theory (IRT) model.
Higher proficiency scores indicate stronger overall performance on the assessment.
The six proficiency categories (Developing Beginner, Beginner, Developing Proficiency, Approaching Proficiency, Proficient, and Advanced) are derived from the proficiency score.
These categories divide students into six groups based on their relative performance within the national LASSO dataset. While the proficiency score provides a continuous measure of performance, the proficiency categories provide a simpler way to interpret student outcomes.
The mastery score uses an algorithm that considers student performance across all assessment items and the statistical relationships between learning objectives. While this situation is uncommon, it is possible for a student to answer all questions associated with a learning objective correctly and still not meet the mastery threshold.
Proficiency scores displayed in the report include a small display adjustment intended to support student self-efficacy and avoid negative values. Downloaded raw data remain unadjusted.
Equivalent scores estimate what a student’s proficiency would look like on other common assessments. These are statistical estimates intended to help instructors interpret proficiency using familiar score scales.
Equivalent scores are not actual test scores.
Students are categorized as “Missing” when they did not complete the assessment and therefore do not have enough data for proficiency or skill mastery calculations.
When missing data are removed, percentages are recalculated using only students who completed the assessment. This can change the reported mastery percentages and provide a clearer view of performance among participating students.
Yes. The report includes an “Across Administrations” view that allows you to compare proficiency scores and skill mastery across different assessment administrations to examine changes over time.
Yes. You can download a PDF version of the report at any time. The downloaded report reflects the currently selected administrations and visualization options.
Comparisons with other courses are intended to provide context for your results. They help you understand how your course’s performance and learning gains compare to broader patterns within the LASSO dataset. These comparisons should be interpreted as general benchmarks rather than precise rankings.